Guides
Taproom Pour Cost Alone Won't Catch Overpouring Losses
Taproom overpouring losses hide inside a healthy pour cost. Here is what the leak costs per keg, per month and per year, and how US taproom POS data exposes it.
What to take away
- Pour cost is a ratio, so a price rise can mask beer that never reached a glass.
- A 1.5 percent overpour on a 15.5 gallon keg wastes roughly 0.23 gallons, about two 16 oz pours.
- At $180 per keg, that is near $2.60 of beer per keg, or $260 a year on 100 kegs.
- Detect it with POS ounces sold against kegs tapped, not with pour cost alone.
- Set a variance tolerance before you accuse anyone of anything.
Why pour cost hides the leak
Pour cost is cost of goods divided by sales. Both numbers move together when you raise prices. A taproom that lifts a pint from $7 to $8 can absorb real spillage and still show a flat 22 percent pour cost on the monthly report.
The ratio answers a pricing question. It does not answer an operational one: did the beer you paid for reach a customer? Those are different questions, and only the second one finds overpouring.
What the leak costs, line by line
Figures below are illustrative and built from a $180 keg of a mid-strength ale at 15.5 gallons, a common US taproom price point. Substitute your own invoice.
What the leak costs
| Loss source | Beer lost per keg | Cost per keg | Cost per 100 kegs |
|---|---|---|---|
| Foamy first pour of the day | 0.10 to 0.20 gal | $1.16 to $2.32 | $116 to $232 |
| Overpoured pints (1.5% to 3%) | 0.23 to 0.47 gal | $2.60 to $5.40 | $260 to $540 |
| Line cleaning and tap flush | 0.05 to 0.10 gal | $0.58 to $1.16 | $58 to $116 |
| Keg blow with beer in the line | 0.08 to 0.15 gal | $0.93 to $1.74 | $93 to $174 |
| Staff and guest tasting pulls | 0.10 to 0.30 gal | $1.16 to $3.48 | $116 to $348 |
| Total | 0.56 to 1.22 gal | $6.43 to $14.10 | $643 to $1,410 |
The low end assumes trained staff, clean lines and a calibrated system. The high end is what a busy taproom sees when nobody is counting.
What scale changes
The numbers above scale almost linearly with volume, and that is the trap. A taproom pouring 400 kegs a year at the high end is looking at $5,640 in beer that left the building without a sale.
Small taprooms feel it differently. At 60 kegs a year the same 1.5 percent overpour is only about $156. That is real money, but it will not show up as a crisis on a monthly profit and loss statement.
Batch size matters on the production side too. A 10 barrel batch fills about 20 sixtels or 10 half barrels. Losing one extra gallon across a whole batch is small. Losing a gallon per keg is 20 gallons, and that is a visible dent in yield.
Where the margin actually goes
Margin leaves through the taproom, not the brewhouse. A pint poured at 22 oz into a 16 oz glass is a 37 percent overpour, and no pour cost report will flag it.
Weekly vs monthly variance count
Weekly count
- Timing
- Every week
- Purpose
- Correction
- Action window
- Days
- Staff impact
- Immediate feedback
Monthly count
- Timing
- Once a month
- Purpose
- Autopsy
- Action window
- Weeks
- Staff impact
- After the fact
The fix is a variance count. Compare ounces rung through the point of sale against ounces that left the keg. Most modern systems track this, and the mechanics are the same ones described in a Square vs Toast vs Arryved POS comparison.
Run the count weekly, not monthly. A monthly number is an autopsy. A weekly number is a correction.
A 2 percent variance on 40 kegs a month is about $144. A 6 percent variance is $432. The gap between those two numbers is a staffing conversation, not an accounting one.
The same discipline applies to packaged and retail stock, which is why a weekly stock control checklist belongs next to the taproom count rather than in a separate binder.
Example: one month at a 12 tap US brewery
March variance at 12-tap brewery
- 38 | kegs poured
- 35.6 | kegs sold per POS
- 2.4 | kegs variance
- 6.3% | variance rate
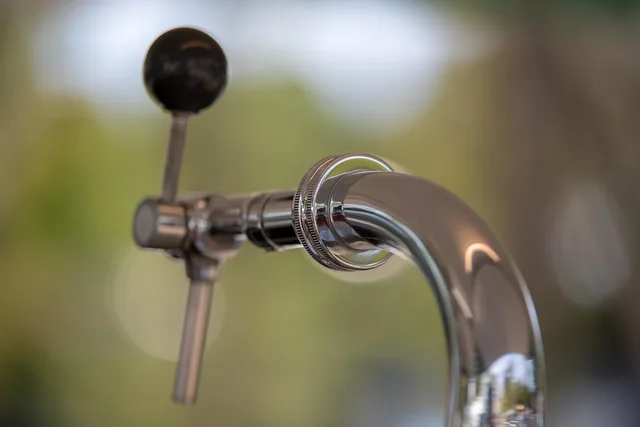
At $180 per keg that is $432 of beer. The manager pulled daily counts for two weeks and found the cause: a foamy tap on line 4 that staff were pouring off into a pitcher and discarding, plus two bartenders free-pouring high-gravity pours without a jigger.
A line service call and a $40 set of measured pour spouts cut the April variance to 1.9 percent. That is roughly $300 a month recovered, or $3,600 a year, from one taproom.
What is easy to forget
- Foamy first pours after a line cleaning
- Kegs tapped before the previous keg is truly empty
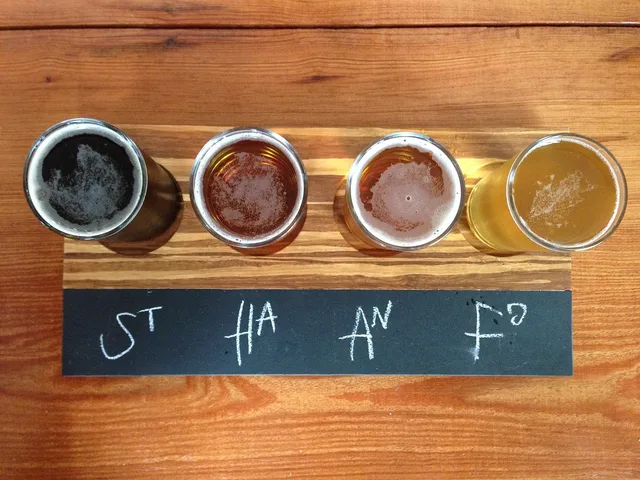
- Tasting flights poured by eye rather than by measure
- Staff drinks and shift beers that never hit the POS
- Growler and crowler fills that overrun the stated volume
Every item on that list is legal, normal and invisible to a pour cost report. Together they can account for most of a taproom's shrinkage.
Invisible shrinkage sources
- Foamy first pours after line cleaning
- Kegs tapped before previous keg empty
- Tasting flights poured by eye
- Staff drinks not rung on POS
- Growler fills overrunning stated volume
Setting a tolerance you can defend
Pick a number before you look at the data. Most US taprooms can operate between 2 and 4 percent variance on draught. Below 2 percent is excellent. Above 5 percent needs investigation.
Write the tolerance into the opening and closing routine, and train against it. A taproom employee training checklist is the right place to record who was signed off on measured pours.
Keep the payroll side clean while you do this. Counting ounces and counting hours are the same management habit, and the recordkeeping rules are set out in the DOL fact sheet on FLSA recordkeeping requirements.
For a fuller picture of dispensing systems and where beer is lost, the draught beer overview covers line length, pressure and temperature, the three variables behind most foam.